- Anchorage School District
- Dashboard
- State Proficiency Assessment
Statewide Assessment
-
Alaska's Department of Education and Early Development (DEED) has partnered with NWEA to implement a creative approach to balanced statewide assessment that better reflects learning throughout the school year and helps educators target instruction to students’ individual needs.
This balanced approach connects fall and winter MAP Growth interim assessments and the Alaska spring summative assessment to provide a comprehensive assessment system that improves efficiency and cohesion and drives student outcomes by prioritizing teaching and learning. Learn more...
AK STAR and Alaska Science Assessment results will be provided to the community as follows:
- November 10 - DEED Press Release to the Public
- December 2 - Parents/Families - Individual Student results posted to ParentConnect
For a complete summary of all ASD District and State required assessments, please visit the Assessment & Evaluation website.
State Proficiency Assessment
-
About the State Proficiency Assessment
The Alaska System of Academic Readiness (AK STAR) and the Alaska Science Assessment are designed to measure a student’s understanding of the skills and concepts outlined in the Alaska English Language Arts (ELA) and Mathematics Standards and the K-12 Science Standards for Alaska. The Alaska English Language Arts, Mathematics and Science Standards provide a rigorous foundation for defining the skills and concepts that students should know and be able to do across grade levels.
- For further information about AK STAR and the Alaska Science Assessment test administration and individual student results, please visit the ASD AK STAR website
- For further information on all state assessments, including results by year, please visit the State of Alaska Department of Education's Assessments Website
Dashboard Data Views: Titles and Definitions
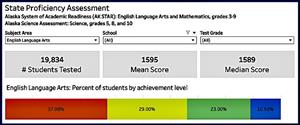
State Proficiency Assessment Overall: Percent students tested by achievement level
This view represents the percent of students tested by each achievement level for the selected filters. This data may be filtered by test subject area (English language arts, mathematics or science), school(s), and grade(s). Each represented component is interactive by both hovering over information and by selecting/deselecting any achievement level. Student groups with fewer than 10 students have been suppressed.
The achievement levels for AK STAR and the Alaska Science Assessment assessments are:
- Advanced (A - blue color) – student meets the standards and demonstrates mastery of the knowledge and skills on a range of complex grade level content
- Proficient (P - green color) – student meets the standards and demonstrates mastery of the knowledge and skills of most grade level content
- Approaching Proficient (AP - yellow color) – student partially meets the standards and may have gaps in knowledge and skills but is approaching mastery of some grade level content
- Needs Support (NS - orange color) – student may partially meet the standards but needs support to master the knowledge and skills of current grade level content
State Proficiency Assessment by Subgroup: Percent of students by gender, ethnicity and achievement level
Represents the percent of students in each grade and achievement level by gender, race/ethnicity and achievement level for the selected filters. This data may be filtered by test subject area (English language arts, mathematics or science), school(s), and grade(s). Each represented component is interactive by both hovering over information and by selecting/deselecting any achievement level. Student groups with fewer than 10 students have been suppressed.
State Proficiency Assessment: Percent of students by school and achievement level
This view represents the percent of students by school and achievement level. This data may be filtered by test subject area (English language arts, mathematics or science), school(s), and grade(s). Each represented component is interactive by both hovering over information and by selecting/deselecting any achievement level. Student groups with fewer than 10 students have been suppressed.
State Proficiency Assessment: Percent of proficient students by school and year
This view represents the percent of proficient students by school and by summative assessment administration year. Percent proficient is calculated by combining students who met the proficient or advanced achievement level. This data may be filtered by test subject area (English language arts, mathematics or science), school(s), grade(s), gender(s), and ethnicity(ies) . Each represented component is interactive by both hovering over information and by selecting/deselecting any achievement level. Student groups with fewer than 10 students have been suppressed.